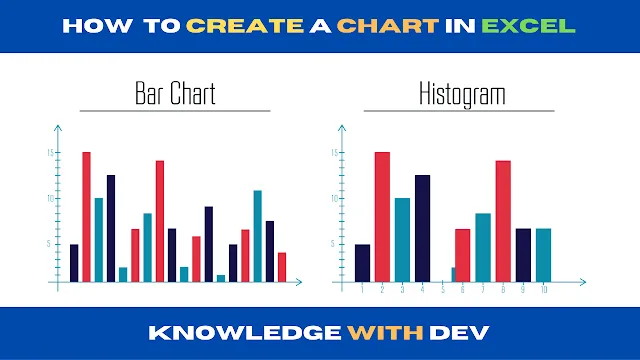
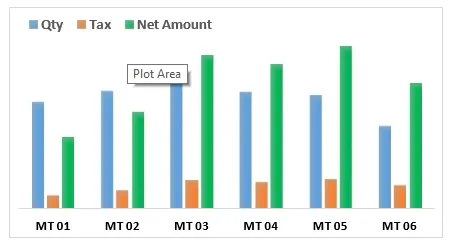
Welcome to Knowledge With Dev, your ultimate resource for mastering Microsoft Excel! In this comprehensive guide, we will take you through the step-by-step process of creating charts in Excel. Charts are an essential tool for visualizing and analyzing data, making it easier to understand trends, patterns, and relationships. Whether you're a beginner or an experienced user, this article will provide you with the knowledge and skills necessary to create impactful charts that effectively convey your data. So, let's dive in and unlock the full potential of Excel's charting capabilities!
Welcome to Knowledge With Dev, the ultimate destination for all your Excel needs! Our goal is to empower you with the skills and knowledge to become an Excel pro. In this detailed guide, we will walk you through the entire process of creating charts in Excel. From selecting the right chart type to customizing it to your specific needs, we've got you covered. Whether you're a student, a professional, or simply someone who wants to learn Excel, this article will equip you with the tools to create visually stunning and informative charts. So, let's get started and unleash your charting prowess in Excel!
How To Create Chart In Excel;
Understanding the Importance of Charts:
- Introduction to the significance of charts in data analysis and presentation.
- Exploring the benefits of using charts to visually represent data.
- Understanding the types of data that are best suited for charting.
Selecting the Right Chart Type:
- Overview of the various chart types available in Excel (e.g., bar, line, pie, scatter, etc.).
- Understanding the purpose and characteristics of each chart type.
- Choosing the appropriate chart type based on your data and the story you want to tell.
Organizing and Formatting Data for Charting:
- Preparing your data in Excel, including sorting and filtering.
- Applying data formatting techniques to enhance chart readability.
- Utilizing Excel's built-in features for managing and analyzing data.
Creating a Chart in Excel:
- Step-by-step instructions on how to create a chart in Excel.
- Exploring different methods for creating charts, including using the Insert Chart feature and Quick Analysis tool.
- Customizing chart elements such as titles, axes, legends, and data labels.
Enhancing Your Charts:
- Applying formatting options to enhance the visual appeal of your charts.
- Adding data series, trendlines, and error bars to provide additional insights.
- Incorporating design principles and best practices to create professional-looking charts.
Modifying and Updating Charts:
- Making changes to an existing chart, including resizing, relocating, and deleting chart elements.
- Updating charts when new data is added or existing data is modified.
- Exploring advanced techniques like dynamic charts and chart templates.
Presenting and Sharing Your Charts:
- Tips for presenting your charts effectively, including choosing the right chart size and layout.
- Exporting charts from Excel to other applications (e.g., Word, PowerPoint) for seamless integration into reports and presentations.
- Sharing charts electronically by saving them as image files or embedding them in documents.
Troubleshooting and Tips:
- Common issues and errors encountered when working with charts in Excel.
- Troubleshooting techniques to resolve chart-related problems.
- Pro tips and best practices for creating professional-quality charts.
Creating charts in Excel is a powerful skill that allows you to transform raw data into meaningful insights. By following the step-by-step instructions and utilizing the tips and techniques provided in this guide, you'll be able to create visually captivating charts that effectively communicate your data. Excel's charting capabilities are limitless, and with practice, you can become proficient in creating charts that make a lasting impact. So, embrace the world of Excel charting and unlock the potential to present data like never before!


%20A%20Powerful%20Tool%20for%20Office%20Automation.webp)


0 Comments
Please don't enter any spam link in the comment box.